Dashboard
The SpecLogician dashboard is a visual UI for the formal state in sl_state.json. It renders the spec, reachability graph, complement regions, and artifact links interactively, and updates live as you apply changes via the CLI or any other client.
There are two surfaces — both driven by the same file:
- VS Code extension — embedded webview inside VS Code. Open via the status bar (
SpecLogician/Browserbuttons), the SpecLogician sidebar, or the command palette (SpecLogician: Open Dashboard). - Standalone browser — local HTTP server serving the same UI to your default browser. Useful outside VS Code or for screen-sharing.
Both surfaces share media/dashboard.js, so feature parity is automatic.
Opening the dashboard
From VS Code
Install the extension (see Installation). Once installed, any folder containing an sl_state.json activates two status-bar items:
SpecLogician— opens the dashboard in a VS Code webview tab.Browser— launches a local HTTP server and opens the same dashboard in your default browser.
Or use the command palette (Cmd+Shift+P) → SpecLogician: Open Dashboard / SpecLogician: Open Dashboard in Browser.
The dashboard also lives in the SpecLogician sidebar (left-hand icon strip) — the "Open Dashboard", "Open in Browser", and "Browse Demos" buttons all funnel to the same commands.
From the terminal (standalone)
If you have the VS Code extension's npm package installed (speclogician-dashboard binary), point it at a state file:
speclogician-dashboard ./sl_state.jsonThis serves the dashboard on a free local port and opens your default browser. The server stays alive until you stop it (Ctrl+C); sl_state.json is re-read on every page refresh, and the page auto-updates when the file changes on disk (Server-Sent Events).
Flags worth knowing:
| Flag | Purpose |
|---|---|
--host <host> | Bind to a specific host (defaults to 127.0.0.1) |
--port <port> | Pin a port instead of letting the OS pick one |
--no-open | Skip auto-opening the browser; just print the URL |
From the dashboard itself
If you have the webview open in VS Code and want to pop it into your browser (for a bigger screen, multi-window editing, or screen-sharing), click the Browser button in the dashboard's top header. The same server starts and your default browser opens — both views stay live and update in lockstep.
Layout
The dashboard has three regions:
- Top header — source path, last-updated timestamp, action buttons (
Open…,Demos,Tour,Browserin webview only), theme toggle. - Left sidebar — every state instance in the file, newest first. Each row shows the change kind that produced it (
PredicateAdd,ScenarioAdd,TransitionEdit, …) plus the change'smetatext. Multi-change instances showBatch (N changes). The bottom-most row is always(initial state). Click any row to view that snapshot. ACompare current with:dropdown lets you pop a structural diff between two instances. - Right content area — tab bar at the top, active tab body below.
Tabs
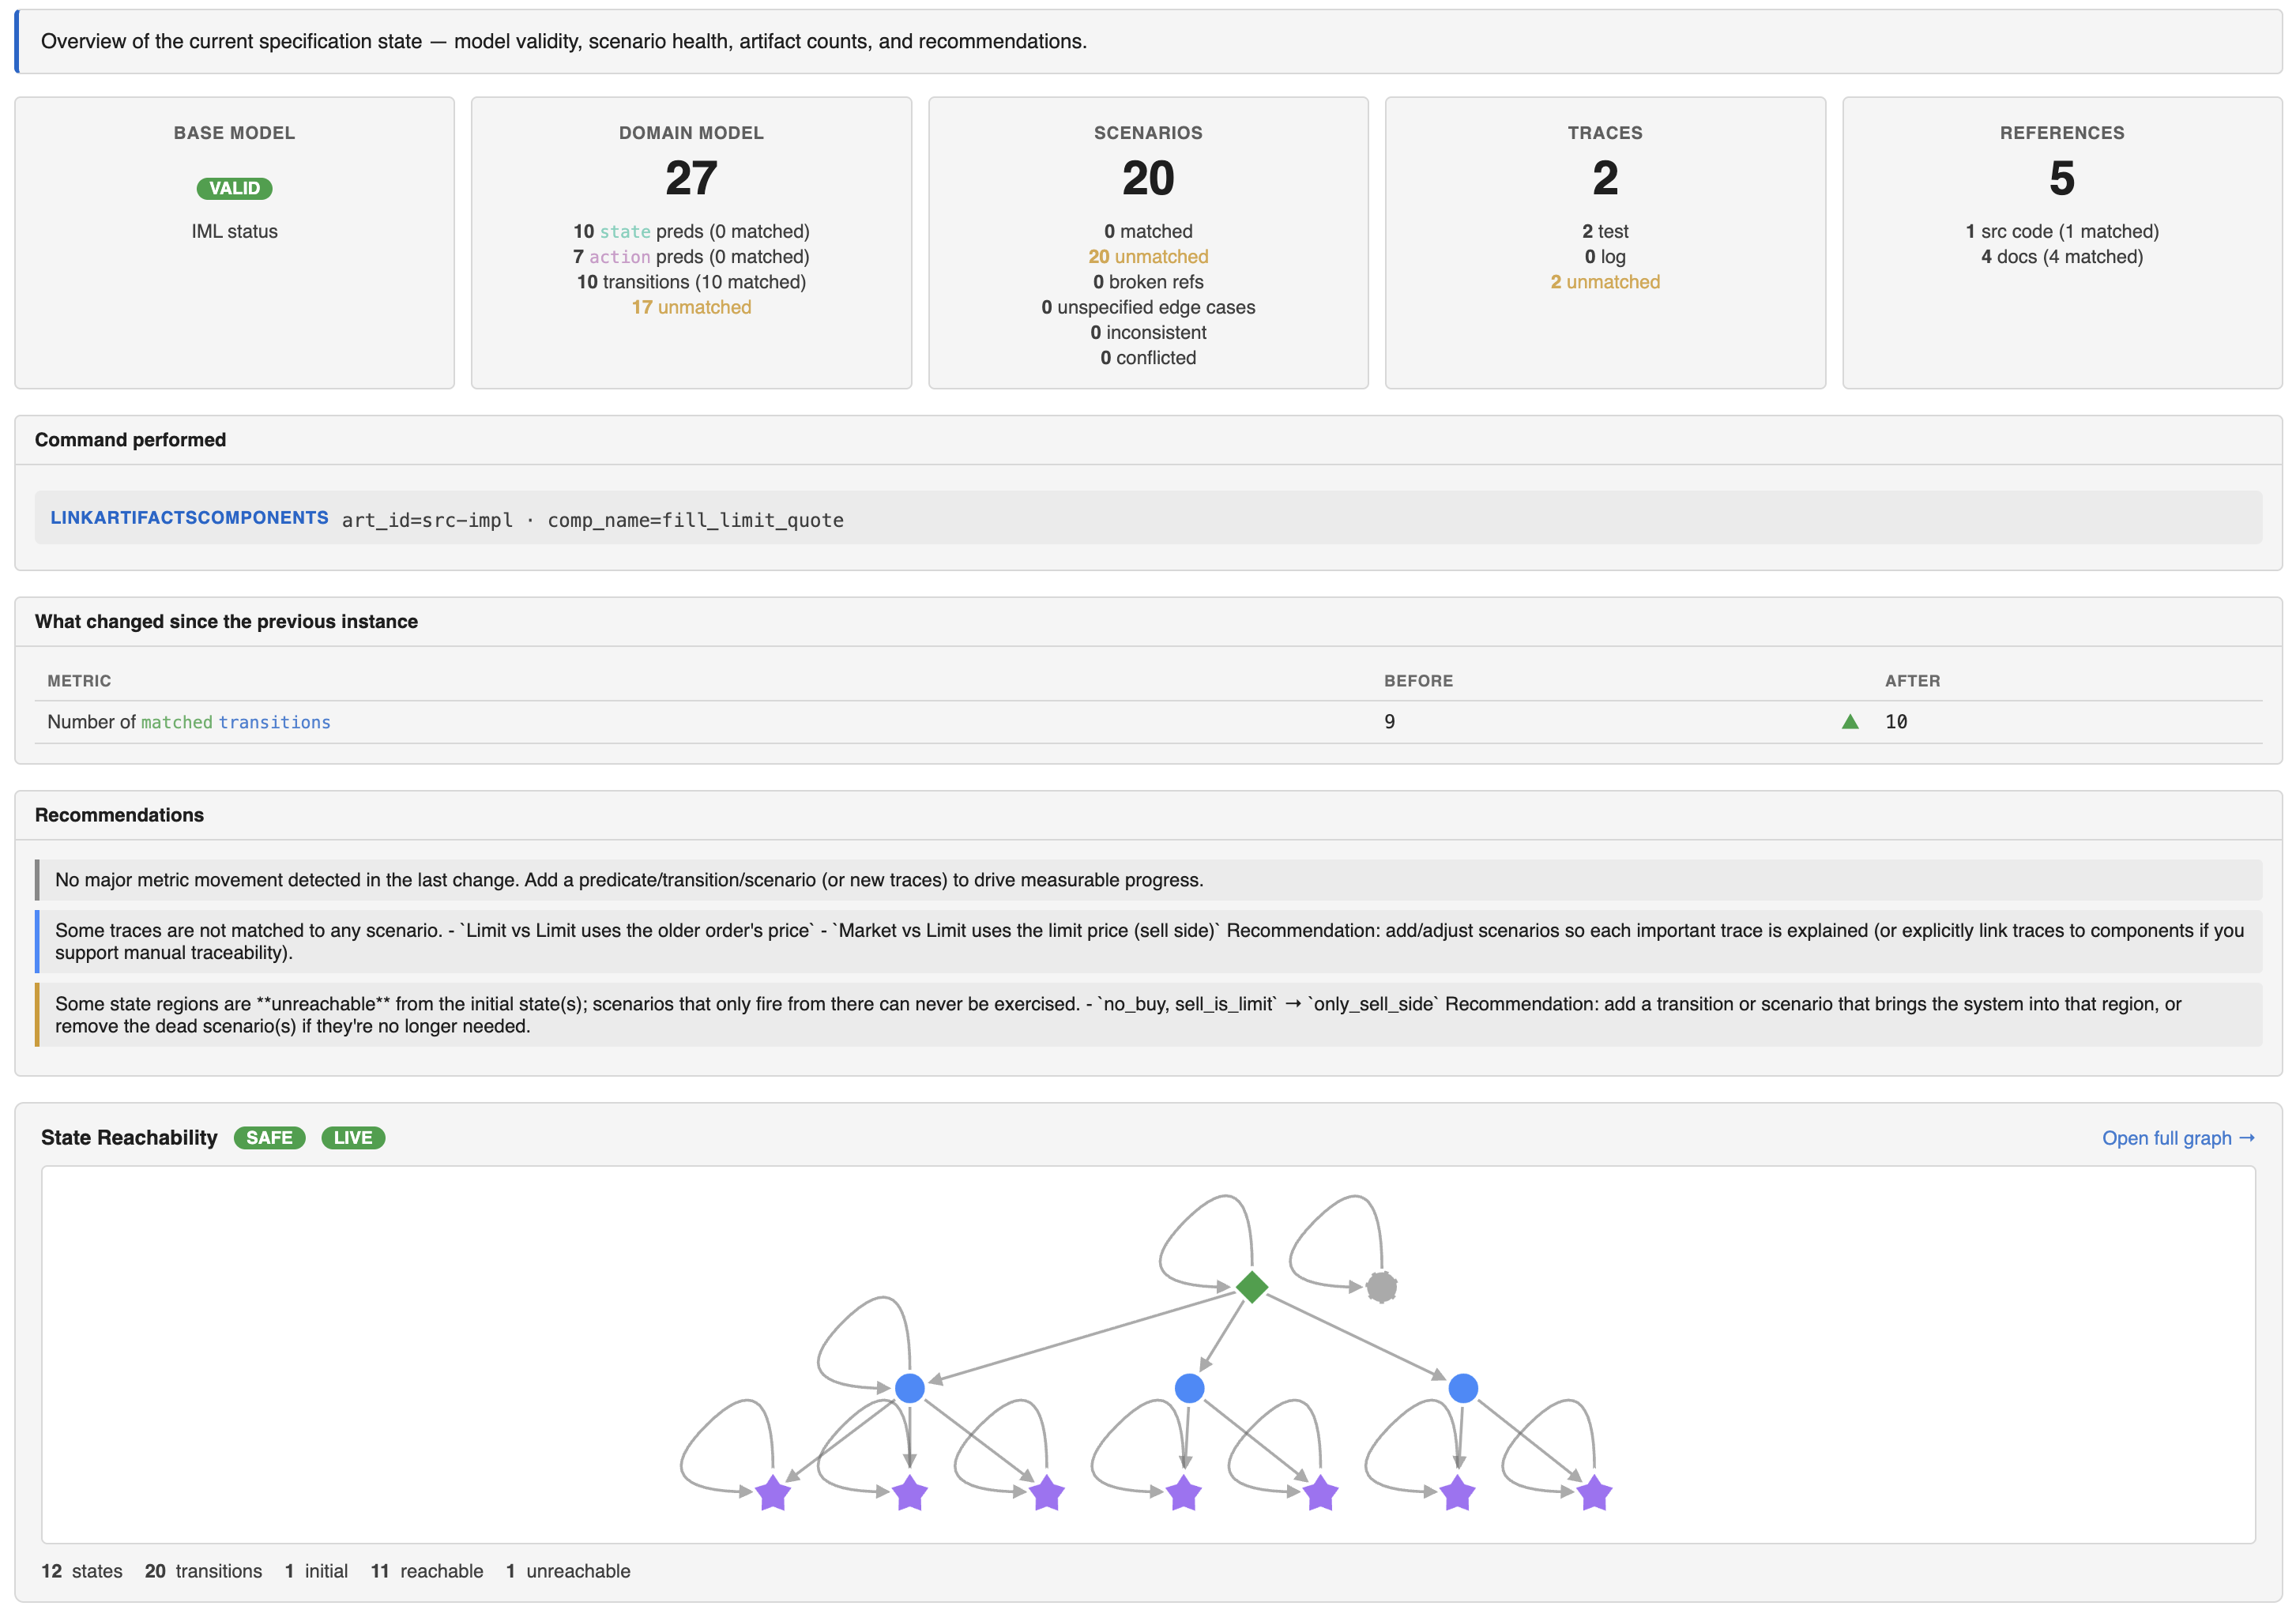
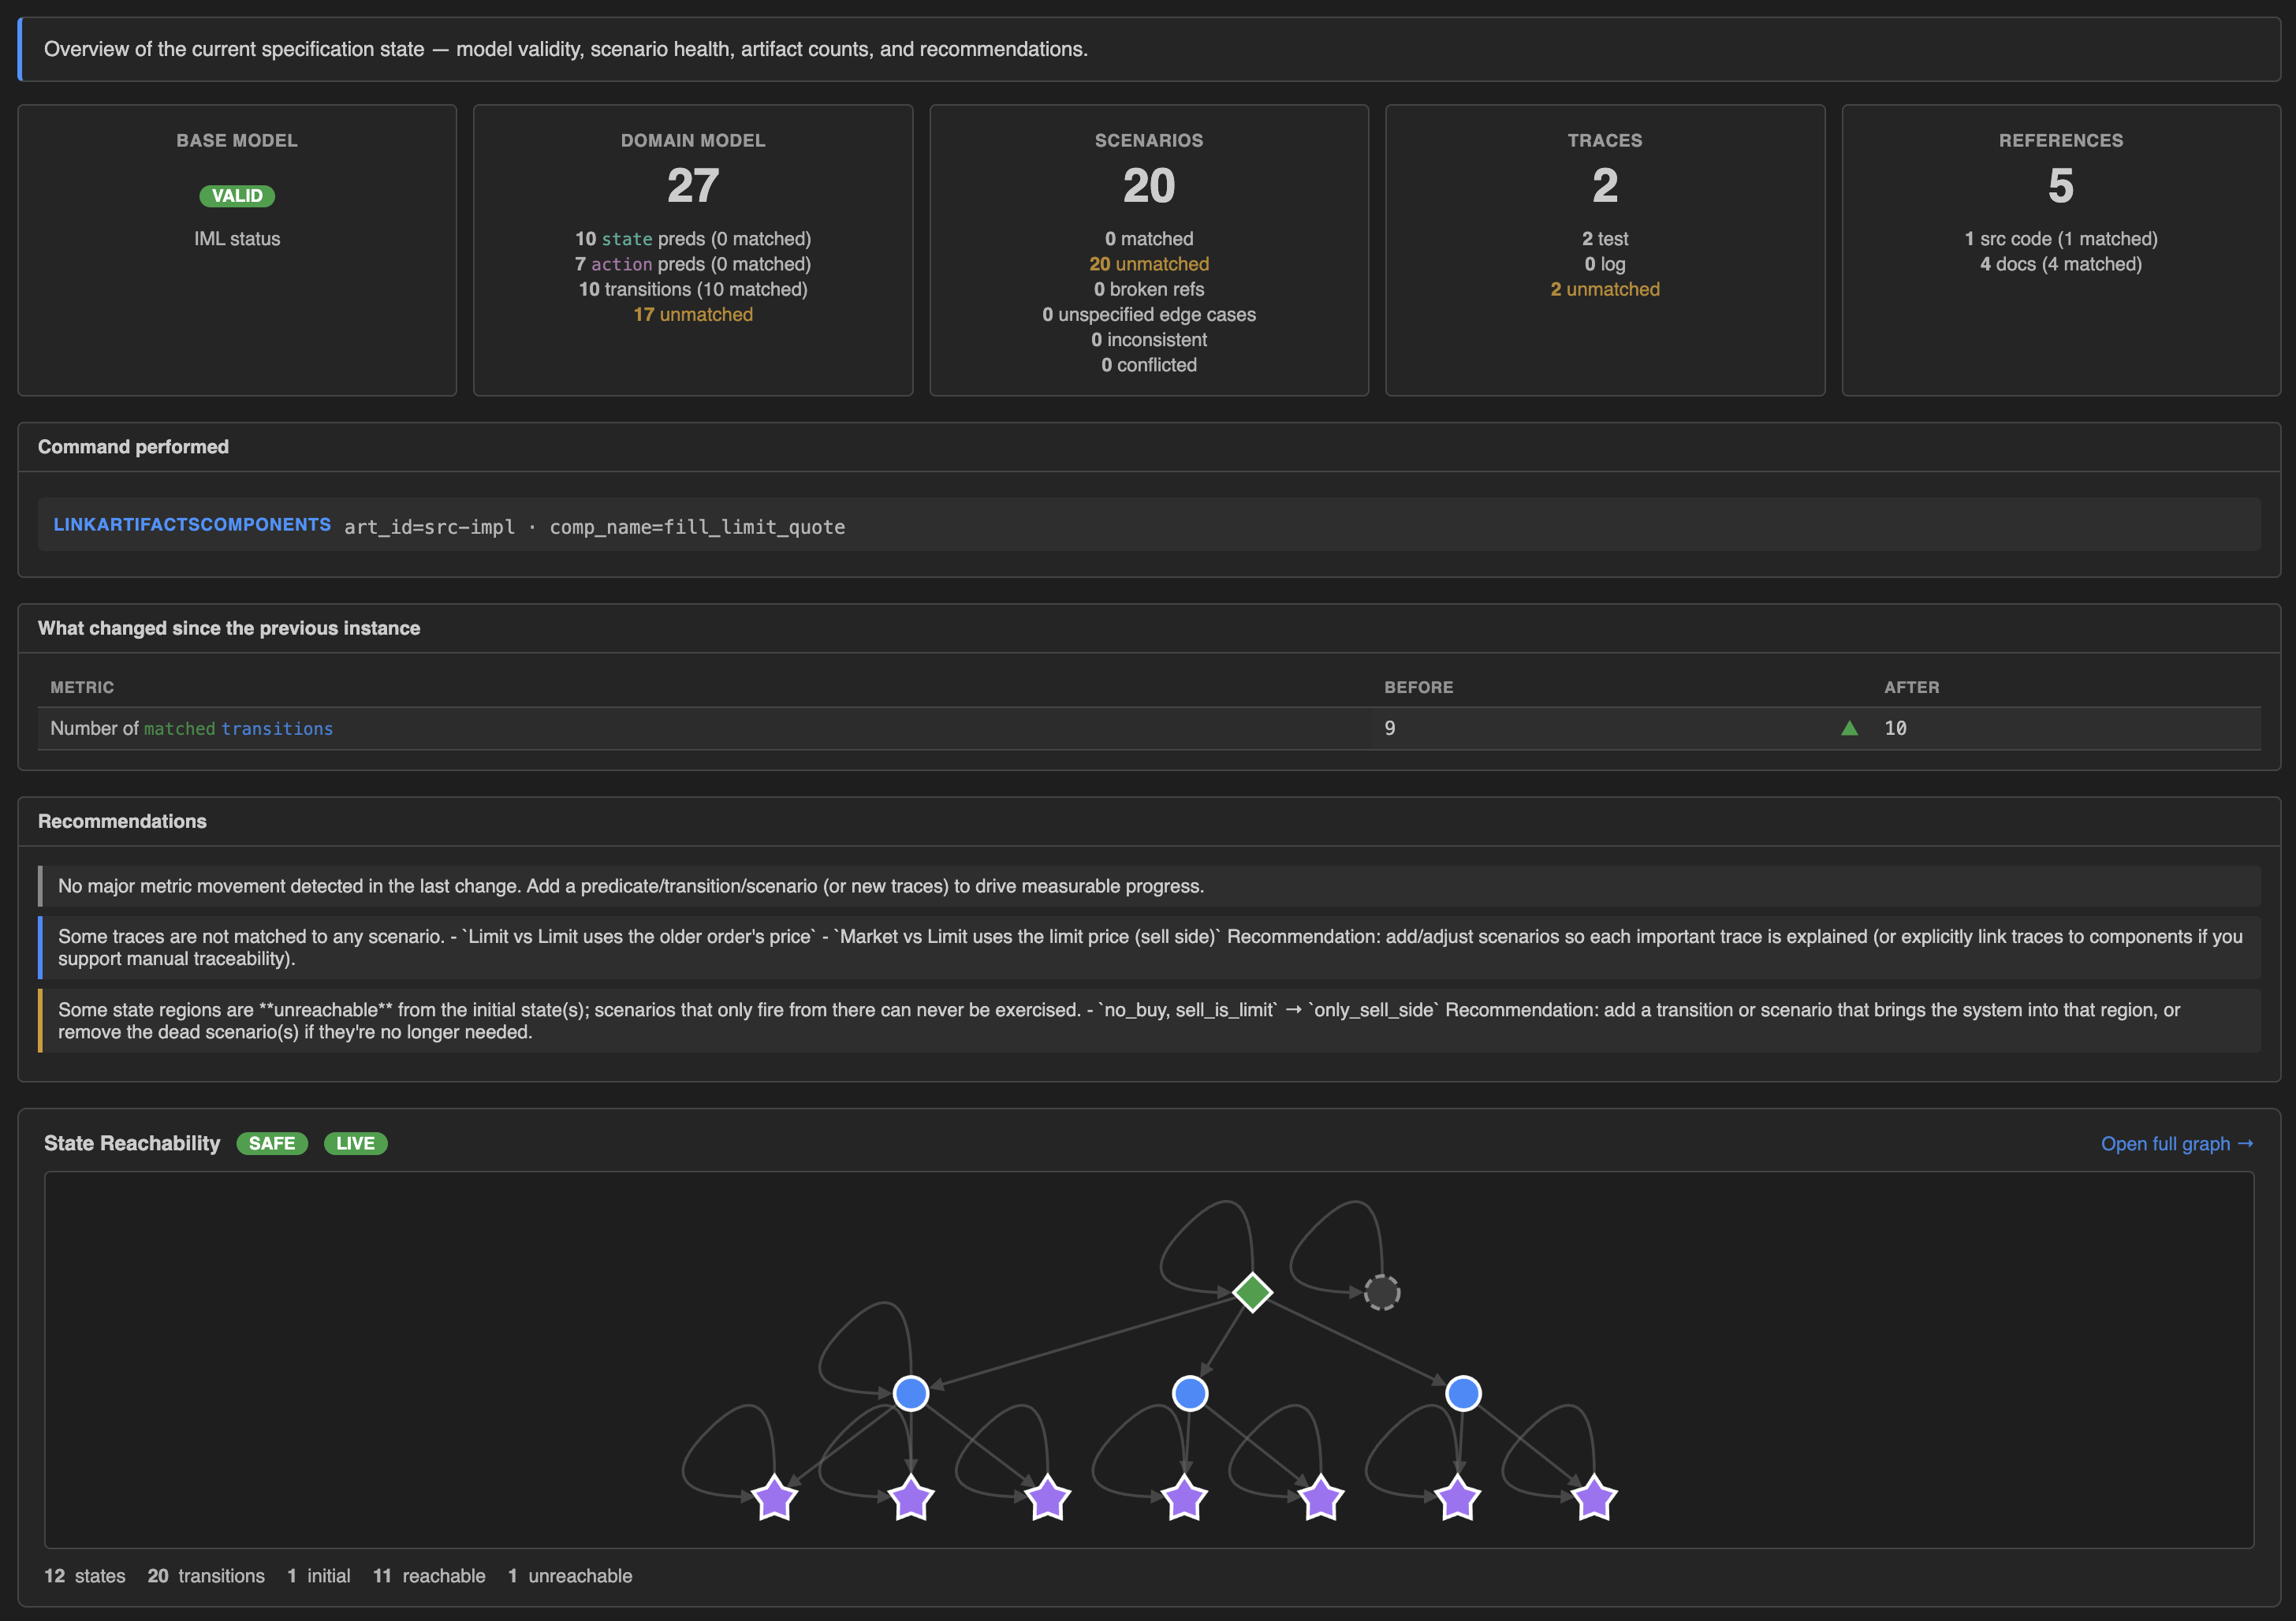
Summary
A high-level overview of the selected state instance:
- Status tiles — Base Model (IML valid/invalid), Domain Model (predicate / transition counts + matched), Scenarios (matched / unmatched / inconsistent / unspecified edge cases), Traces, References.
- Commands performed — collapsible list of every change that produced this instance. Each card shows the change kind, meta description, and (on expand) the change-specific operand fields with syntax-highlighted IML.
- What changed since the previous instance — semantic diff table (counts, validity, reachability, coverage).
- Recommendations — agent-facing suggestions ranked by priority.
The Spec
Sub-tabs:
- Overview — domain-model header with state/action type definitions and aggregate validity.
- Predicates — state and action predicates, each row showing name, validity badge, linked artifacts, scenarios that reference it, and the IML body. Optional
descriptionprose appears under the name. - Transitions — same shape as predicates: name, validity, linked artifacts, scenarios that fire this transition, IML body, optional description.
- Scenarios — collapsible cards showing given / when / then chips, flags (
initial,goal,bad), conflicts (overlap / consumed), linked artifacts, and the per-scenario IML evaluator with a Copy button. The optionaldescriptionrenders in an accent-bordered block at the top of the body. - Missing/Unspecified Edgecases —
(state, action)regions no scenario covers, computed via complement decomposition. Similar regions are grouped into clusters when they share a state-predicate core. Each cluster expands into individual variants showing constraints (split bys./a.side), invariant, sample model (let s = { ... } / let a = { ... }blocks), and a Related to this gap section pointing at predicates and scenarios that touch the same fields. - Full IML Model — the entire spec as a single IML source block. Copy button included.
Reachability Graph
An interactive graph of the spec's reachability — nodes are state regions, edges are scenarios. Cytoscape-based; supports pan, zoom, click-to-focus.
Node colors and shapes:
| Kind | Shape | Color |
|---|---|---|
| Observed (default) | ● circle | blue |
| Initial | ◆ diamond | green |
| Goal | ★ star | purple |
| Bad | ⬡ octagon | red |
| Sink (off-spec) | ▢ rounded rectangle, dashed border | copper |
| Unreachable | ● circle, dashed border, dimmed | grey |
Click a node to see its given predicates (observed) or post-state valuation (sink), the scenarios firing from / landing on it, and outgoing transitions. Click an edge to see the scenario(s) that produce it and the solver witness (a concrete let s = { ... } and let a = { ... } pair, syntax-highlighted).
A Find state… search at the top of the graph focuses matching nodes. Layout defaults to top-to-bottom dagre; can be switched via the layout dropdown.
Artifacts
Documents, source-code refs, test traces, and log traces. Each artifact shows its ID, text/code preview, linked components (with click-to-jump back to the Predicates/Transitions/Scenarios tab), and metadata. Sub-tabs separate the four artifact kinds.
Live updates
Both surfaces auto-refresh when sl_state.json changes on disk:
- VS Code webview — the extension watches the file with
fs.watch, debounces by 100 ms, and pushes the new state to the webview viapostMessage. Scroll position, theme, and collapsed sections survive the update — only the rendered content changes. - Standalone browser — the local server opens an EventSource (
/events) on first page load and pushesstate-changedevents whenever the file mtime changes. Same in-place rendering, same UX.
This means a typical iteration loop is:
- Open the dashboard once at the start of a session.
- Run
speclogician ch …commands (or let an agent run them) in another terminal. - The dashboard updates in real time — you see the new state instance appear in the sidebar, the affected tab refreshes, and any new reachability / safety / liveness changes propagate.
No need to close and re-open the dashboard between changes.
Theme
The dashboard ships with two themes (light and dark). The default follows the host:
- In the VS Code webview: matches VS Code's current theme via the body class (
vscode-light/vscode-dark). - In the browser: matches
prefers-color-scheme(your OS dark-mode setting).
A ☀ Light / ☾ Dark toggle in the top header overrides the host detection. Your explicit choice is persisted to localStorage so it survives page reloads.
Reachability-graph labels (which Cytoscape paints directly to canvas, not via CSS) re-resolve their colors from the actual rendered background, so the toggle works uniformly regardless of which surface you're on or how you got to the current theme.
Source state and demos
The dashboard always shows the state from one of:
- The workspace's
sl_state.json(default in VS Code; passed as positional arg in standalone). - A bundled demo (
Demosbutton → quick-pick → a fresh in-memory copy). - Any file picked via the
Open…button (re-points the webview at a differentsl_state.jsonwithout restarting).
All three flow through the same rendering code; the source path is shown in the top header so it's always clear which file you're looking at.
Keyboard shortcuts
| Key | Action |
|---|---|
/ | Focus the nearest filter input (predicate list, scenario list, edge-case list, graph search) |
↑ / ↓ | Move between state instances in the sidebar |
Cmd/Ctrl+Shift+R | Hard refresh (if changes don't appear, this bypasses the browser cache) |
Where the dashboard fits in the workflow
The CLI and dashboard are complementary surfaces over the same data:
- The CLI (
speclogician ch …) is for making typed changes — scriptable, auditable, agent-friendly. - The dashboard is for seeing what changed and what it means — the reachability graph, complement regions, conflict pairs, and artifact links are far easier to read visually than as JSON.
A typical session uses both: the CLI (or an agent) writes changes, the dashboard renders the resulting state. The examples show this loop in action — each example's "Building this model with the CLI" section is the kind of script you'd run while watching the dashboard update in real time.